Planning In Numbers 2023
- Introduction
- 2019-2023 in Numbers
- Statutory Plans
- Planning Applications
- Residential Development
- Non-residential Development
- Planning Appeals
- Planning Enforcement
- Land Activation and Vacancy
- Legal Challenges
- Cost of Operating
- Resources
- Climate Action
- Highlights
- Reference Data List
- Map of Local Authorities
Introduction
‘Planning in Numbers’ provides a strategic review of key trends and outputs during 2023, and a comparison of patterns over the last five years where figures are available for that period.
Planning in Numbers uses data from statistics published by the Central Statistics Office (CSO), the National Oversight and Audit Commission (NOAC), the Department of Housing, Local Government and Heritage (DHLGH) and An Bord Pleanála (ABP).
This analysis focuses on key indicators related directly to functions such as forward planning; development management; planning appeals; planning enforcement, land activation, vacancy, legal challenges, and costs of operating local authority planning functions that are presented in the previous series. In addition, some indicators are introduced related to resources and climate action.
The figures presented in the analyses are rounded to one decimal place.
2019-2023 in Numbers

24,448 Planning Applications Granted
2023
3,113 Planning Applications Refused
2023

2,035 Appeals to An Bord Pleanála
2023
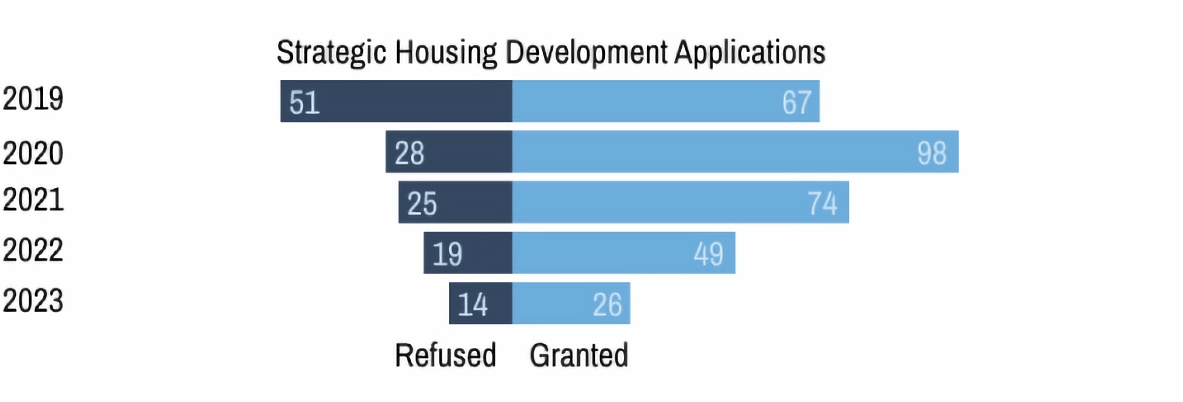
26 Strategic Housing Development Applications Granted
2023
14 Strategic Housing Development Applications Refused
2023

64 Public Consultations on Statutory Plans Initiated
2023
22 Statutory Plans Adopted
2023
Statutory Plans

Since 2021 there has been an ongoing increase in the volume of public consultation processes related to statutory plan-making. This trend continued in 2023 with the initiation of 64 public consultation processes, of which 13 related to city/county development plans (CDPs) and 51 to local area plans (LAPs).
The highest number of notifications related to city/county development plans was nine, relating to variations. Regarding local area plans, the highest number was 19, which was for issues papers.
In 2023, there were a total of 22 plan adoptions. Three CDPs were adopted and six variations were made to existing CDPs. Thirteen of the plans adopted were LAPs.
- CDP
- 1
- 2
- 1
- 9
- Issues Paper
- Draft Plan
- Material Alterations
- Variations
- 19
- 17
- 15
- N/A
- LAP
2
0
2
3
Planning Applications

During 2023 the number of the valid planning applications decreased from the previous year. The number of the valid applications in 2023 is 30,578 – 1,793 less than the previous year


The national average rate for invalid applications (applications that do not meet the preliminary requirements) increased from 2021-2023. The average rate in 2023 is the highest in the last five years. In 2023, the invalidation rate decreased in only six local authorities.
The invalidation rates improved in the following local authorities when compared to five years ago: Cork County, Donegal, Dún Laoghaire – Rathdown, Fingal, Kilkenny, Leitrim, Meath, Sligo, Tipperary, and Wexford.
There is a wide variation across the local authorities with the range changing between lowest (South Dublin) 8.2% to highest (Carlow) 36.2%. Sixteen local authorities have a rate over the national average in terms of invalid applications (as highlighted in Table 1). Cavan, Clare, Kilkenny, Mayo, Monaghan, South Dublin and Westmeath are the only counties below the national rate during the last five years.


The planning application grant rate is high overall, showing a consistent pattern. In the last five years, the national rate changed between 87.4% (lowest) to 89.2% (highest), with a slight increase in 2023 (from 87.4% to 88.7%). In 2023, local authority based rates vary between 78.5% (Galway County) to 97.3% (Leitrim). Thirteen counties have an approval rate below the national average (as highlighted in Table 2). These thirteen counties also have the highest refusal rates which are greater than 10%.
The number of the decisions to grant or refuse a permission varies within local authorities. Cork County and Dublin City are the local authorities with the highest number of decisions.


The number of planning applications approved in 2023 is lower than the previous four years, with a total figure of 24,448. The total number of granted applications decreased in 2023 across all three regions. The overall share of planning applications granted by regional assembly area is Eastern and Midland Regional Assembly (EMRA) 40%, Southern Regional Assembly (SRA) 37% and Northern and Western Regional Assembly (NWRA) 23%.

Planning permissions granted are categorised under eight different use types by the CSO. Based on this categorisation, although there is a general reduction, dwellings is the largest share in 2023. Setting aside other functional categories, civil engineering and commercial buildings are the next largest shares. This same pattern is recognisable through the five-year period.
Residential Development
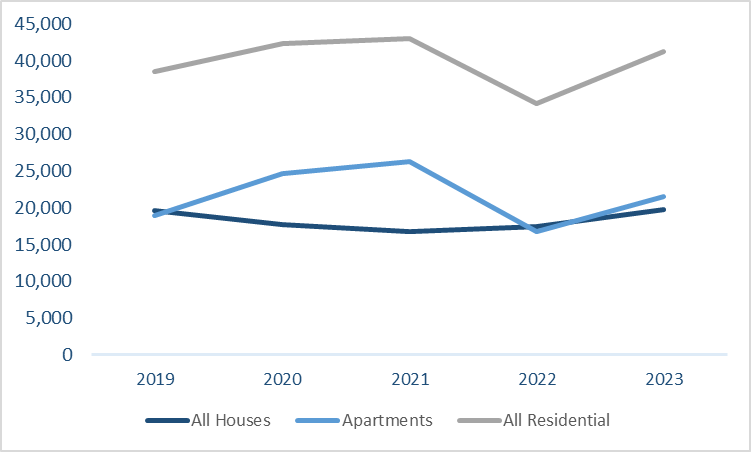
In 2023, 41,225 residential units were granted planning permission. This figure represents a significant increase over 2022 when 34,177 residential units were granted planning permission. This increase was reflected in permissions granted for both houses and apartments. In 2023 the number of permissions granted for apartments was higher than houses. (12.2%) in 2023.
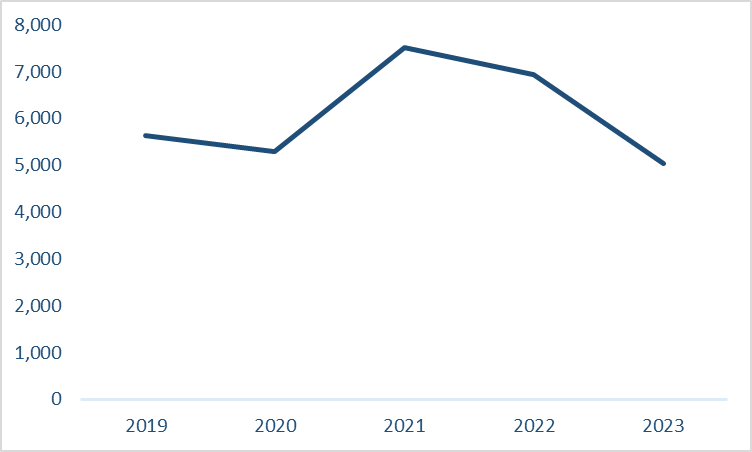
The number of permissions granted for one-off houses decreased from 6,924 (20.3%) in 2022 to 5,032 (12.2%) in 2023.
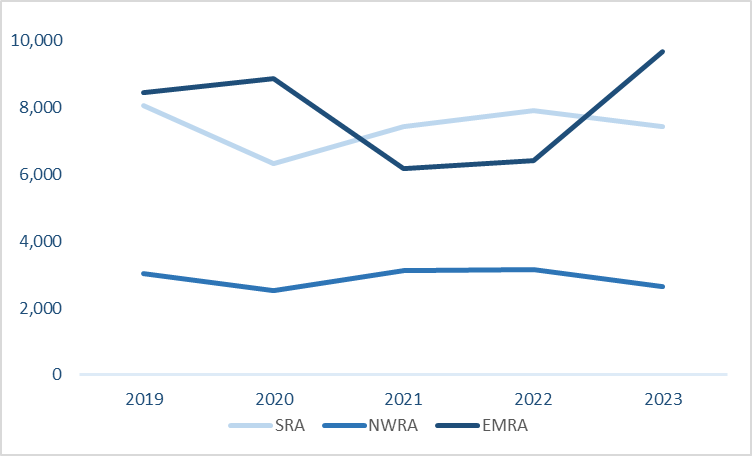
In terms of the distribution of permitted residential units through the regional assembly areas, EMRA has the highest number (25,581 – 63%) followed by SRA (11,769 – 28%) and NWRA (3,575 – 9%).
In each regional assembly the number of permitted residential units increased in 2023. The number of houses permitted increased only in EMRA and decreased in other regional assembly areas. The number of apartments increased in all regional assembly areas.

As in previous years, apartment development was mainly concentrated in Dublin (which consists of four local authorities) during 2023. In addition to apartments, the number of houses permitted in Dublin increased in 2023 while in all the other cities this decreased. In terms of apartments, compared to 2022, Galway City, Cork City and Dublin were the only cities experiencing an increase.

In 2023, the number of residential units completed continued to increase. The increased rate of apartments was higher than the scheme and single houses. The total number of units completed in 2023 is 32,548 (2,886 more than 2022). After some steady years from 2019 to 2021, residential completion numbers are increasing.
Non-residential Development

In terms of non-residential permitted floor space there was an increase for the categories: education, hotels, transport, office, health, entertainment, and crèche. Permissions for industry, agriculture, trade, and mining floor space declined.
Planning Appeals

The number of appeals to ABP continued to decrease in 2023. However, the rate of planning authority decisions appealed to ABP remained relatively consistent, between 7.2% and 7.4%.

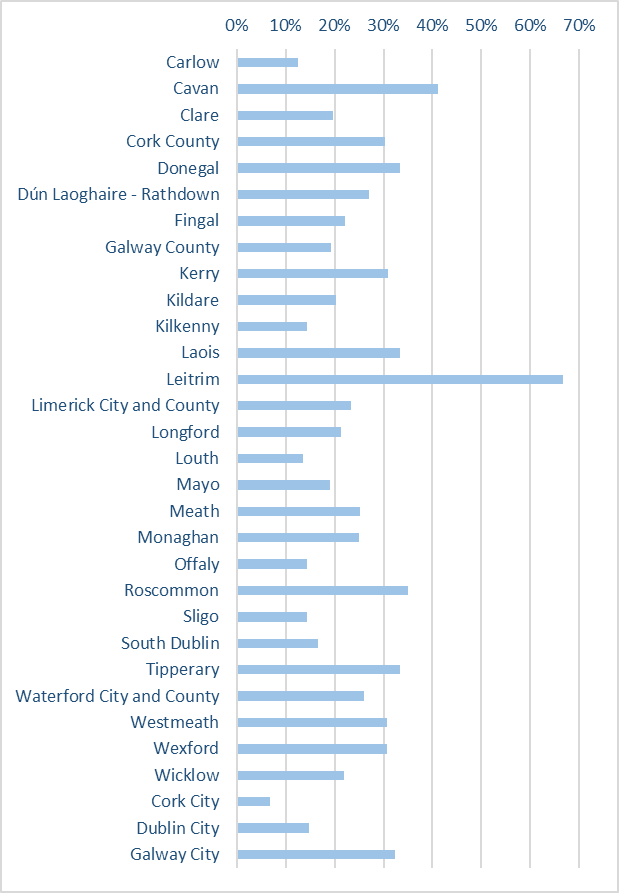
The reversal of decision on appeal rate decreased in 2023. After a brief increase around 2019-2020, this rate is declining and at its lowest level in the last five years (22.4%).
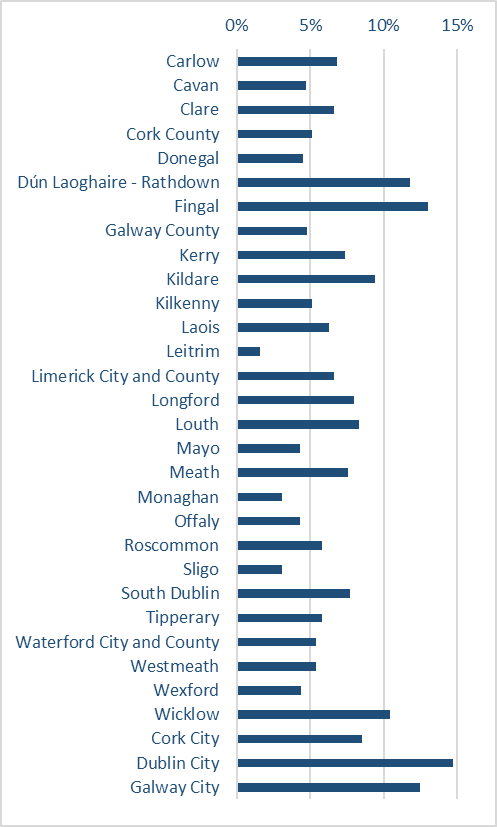
In terms of local authorities, the appeal rates vary from 1.6% to 14.7%.
The percentage of reversed decisions based on appeals also differ by local authority. When the reversed rate is checked, based on the number of all applications, highest rates are in Galway City (4.1%) followed by Dún Laoghaire – Rathdown (3.2%) and Fingal (2.9%)
Planning Enforcement
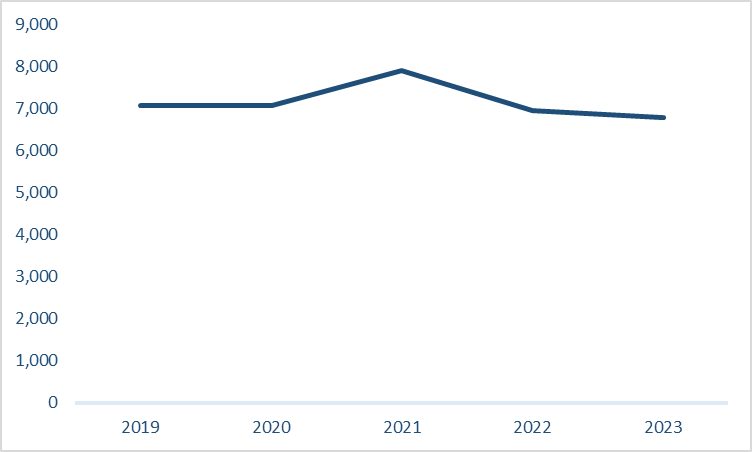
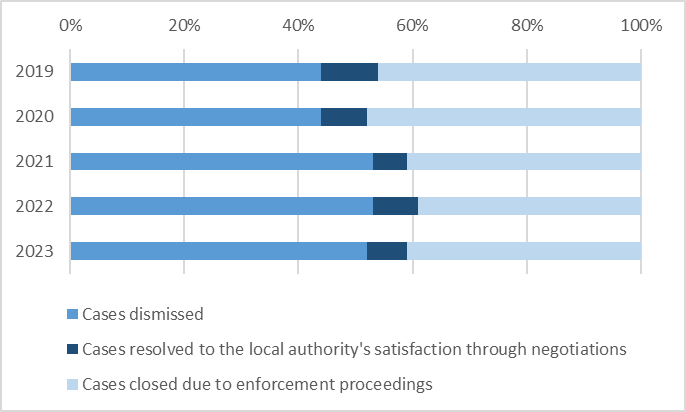
The NOAC Local Authority Performance Indicator Report identifies the number of planning enforcement cases – either referred by the public or local authorities themselves – that are investigated by local authorities. During 2023 local authorities investigated 6,783 new enforcement cases, a comparable figure to the 6,959 new cases opened the previous year. The number of planning enforcement investigations closed during 2023 was 6,453, a decrease of 238 on the number of cases closed in 2022. The cases are closed for a variety of reasons. Between the years 2021-2023, the main reason is cases being dismissed
Planning Land Activation and Vacancy


In 2023 there was a small decrease nationally in the number of the derelict residential properties, from 22,279 to 21,947. Derelict residential properties are mainly in the NWRA area (11,278).
Based on the register kept by the local authorities, the number of derelict sites entered in 2023 was 578. This figure has increased significantly since 2021 (212). However, 238 sites were removed from the derelict sites register in 2023, slightly less than the previous year (301). In 2023, 4,991 Vacant Property Refurbishment Grant applications were received and 3,000 applications were approved.
Legal Challenges
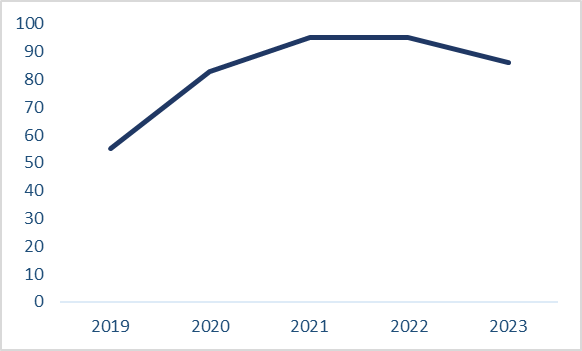
Judicial review cases taken against ABP decreased in 2023 for the first time in five years. There were 95 cases in 2022 and 86 in 2023.
Cost of Operating

Based on the latest available Local Authority Financial Statement Report (2022), the operating cost of the 31 local authorities’ statutory planning functions was €171.4m in 2022, an increase of €9.8m on the €161.6m in 2021. The operating cost increased year on year since 2018 (€140.5m). The income from planning fees has increased from €27.4m (2021) to €28.8m (2022). However, the income generated from the planning fee is not increasing at the same rate. In 2022, while the income from the planning fee increased by €1.4m, the operating cost expense increased by €9.8m.
Local authority planning fee income represented only 17% of the overall cost of running the planning service for 2022. This proportion is relatively static, changing between 16% and 18% for the five-year period 2018- 2022.
According to NOAC’s Local Authority Performance Indicator report, there was an overall increase of 18.8% in the cost per capita of services provided by local authorities relating to planning in the last five years. Cost per capita figures are calculated based on the relevant census. For 2023 the latest census 2022 data was used. The average per capita cost of the planning service in 2023 was €35.97, compared with €33.54 in 2022. The NOAC report noted that development plan preparations are becoming more complex and costly.
Resources
Resourcing of the local authority planning sector remained an area of critical concern during 2023. Following analysis completed in 2022 (through the Local Government Management Association (LGMA) in conjunction with the DHLGH), the requirement for over 500 technical and non-technical posts in local authority planning departments was identified. This would represent an average uplift of 35% on 2022 staffing numbers. This would be in addition to the posts (10-11%) vacant at the time of the analysis.
In response, the government sanctioned 100 additional planning-related posts for the local government sector in 2023 as an initial phase of recruitment. However, as OPR reviews conducted during the course of 2023 demonstrated, this is only a first step, given the current challenges in recruitment and retention experienced by local authorities.
The Irish Planning Institute (IPI) published a Census of the Planning Profession during 2023 which showed that almost half of respondents were over the age of 45, with 6% in the 54-65 years of age category. This further highlights the resourcing challenges that the overall sector will be navigating for the foreseeable future.
The implementation of the Ministerial Action Plan on Planning Resources published in September 2024 will support the sector in addressing the urgent demand, and resource needs.
Climate Action
In March 2023, statutory guidelines were issued to support local authorities in setting their Local Authority Climate Action Plan (LA CAP).
A preliminary analysis of the Climate Action Plan actions was undertaken by Climate Action Regional Offices (CARO). Their report published in October 2024 shows a total of 3,935 actions were adopted across local authorities. A total of 262 of the total actions have been categorised as planning related actions. These include actions relating to:
- Planned sustainable development
- Public transport
- Renewable energy infrastructural policy
- Sustainable management considerations in planning application process
- Town centre first
- Electric vehicles and infrastructure
Highlights
This analysis of 2023 data indicates that Ireland’s planning system continues to perform statutory duties in the context of increased pressure.
Data presented here reflects only part of the work of local authorities, who also undertake a significant volume of additional planning related work such as development promotion, urban renewal, and rural development.
The figures for 2023 show that local authorities continued to concentrate their forward planning resources on preparing or completing their development plan reviews. The increase in the publications of issue papers for local area plans (LAPs) indicates that the local authorities have begun to focus on preparing detailed plans.
Planning, like other sectors, is experiencing resource challenges as well as looking to technological advances and related challenges and opportunities. The Ministerial Action Plan on Planning Resources is welcomed and will assist the sector.
It is interesting to look across the five-year period. This provides clarity on consistent and varying trends and figures.
In the context of balanced regional growth, the five-year pattern of granted permissions for houses and apartments between regional assembly areas may merit investigation.
In recent years new online planning application systems have been introduced in several local authorities. There may be value in investigating the level of invalid applications.
The data shows the increasing cost of providing planning functions. While income from planning fees is increasing, this is at much lower rate. Planning fee income represents 17% of the overall cost of providing planning functions in 2022.
All trends presented through different datasets need careful monitoring and further consideration as the planning sector continues to evolve.
Climate action is of growing importance, and planning related actions are being adopted across the local authorities. Collating and utilising planning statistics related to climate action will be beneficial in supporting this vital work into the future.
Reference Data List
The references are outlined below, where available the data can be obtained from the hyperlinks.
Annual Report 2023 OPR
Figure 1
Department of Housing, Local Government and Heritage
Annual Planning Applications Table 1, Figure 2, Figure 3, Figure 4, Figure 5, Table 5, Figure 6, Figure 7
Central Statistics Office: Planning Permissions Granted
Figure 8
Central Statistics Office: Planning Permissions Granted for New Houses and Apartments
Figure 9, Figure 10, Figure 11
Central Statistics Office: New Dwelling Completions
Figure 12
Central Statistics Office: Planning Permissions Granted for Non Residential Buildings
Figure 13
An Bord Pleanála: Annual Report and Appendices 2023
Figure 14, Figure 15, Figure 16, Figure 20
National Oversight and Audit Commission
Figure 17, Figure 21
Derelict Sites via Geodirectory (Regional Development Monitor)
Figure 18
Houses of the Oireachtas
Figure 19
Ministerial Action Plan on Planning Resources
Climate Action Regional Office: Local Authority Climate Action Plans
Map of Local Authorities
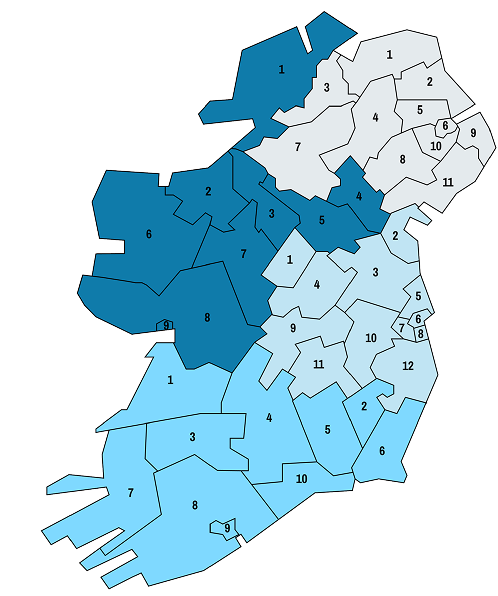
Southern Regional Assembly
- Clare
- Carlow
- Limerick City and County
- Tipperary
- Kilkenny
- Wexford
- Kerry
- Cork County
- Cork City
- Waterford City and
County
Eastern and Midland Regional Assembly
- Longford
- Louth
- Meath
- Westmeath
- Fingal
- Dublin City
- South Dublin
- Dun Laoghaire – Rathdown
- Offaly
- Kildare
- Laois
- Wicklow
Northern and Western Regional Assembly
- Donegal
- Sligo
- Leitrim
- Monaghan
- Cavan
- Mayo
- Roscommon
- Galway County
- Galway City
Local Authorities in Northern Ireland
- Causeway Coast and
Glens - Mid and East Antrim
- Derry and Strabane
- Mid Ulster
- Antrim and Newtownabbey
- Belfast
- Fermanagh and Omagh
- Armagh, Bannbridge and
Craigavon - Ards and North Down
- Lisburn and Castlereagh
- Newry, Mourne and Down
